An analysis of the Tips dataset using pandas and seaborn
Exploratory data analysis and regression using Python
This post is an overview of a project submitted for the Fundamentals of Data Analysis module at GMIT as part of the Higher Diploma in Computing and Data Analytics.
The project involved performing an analysis of the Tips dataset, exploratory data analysis and regression.
The aim of the project was to put into practice the core concepts of the module with the Python pandas and seaborn libraries using the Jupyter notebook environment.
There were 3 distinct tasks involved in this project.
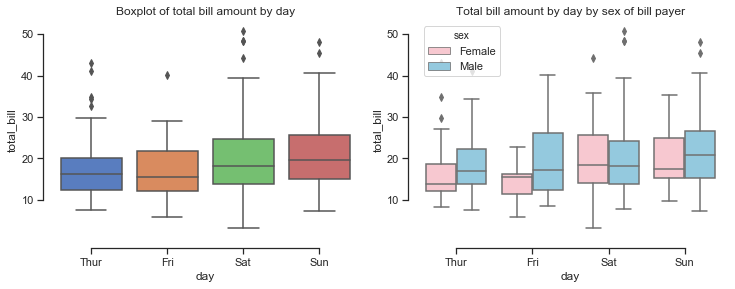
Describing the Tips dataset using descriptive statistics and plots
Regression: discussing and analysing whether there is a relationship between total bill and tip amount
An analysis of the relationship between the variables in the dataset
This post provides an overview of the project.
The project itself can be downloaded or cloned from the project repository at https://github.com/angela1C.
The Tips dataset is a very small dataset, is widely available online and can be easily read into a pandas DataFrame directly from the URL.
The Tips dataset has only 244 rows and 7 variables which represents some tipping data where one waiter recorded information about each tip he received over a period of a few months working in one restaurant.