Exploring Irish weather datasets from Met Eireann using the Plotly Dash framework
In this post I am exploring some weather datasets as measured by Met Eireann using the Plotly Dash framework. I have a very basic dash app deployed here on Heroku. The app uses some dropdowns, sliders, tabs, markdown and graph components, using callback functions to link the user’s options with some plots.
I initially looked at some hourly and monthly weather datasets published by Met Eireann and listed on the Irish open data portal at https://data.gov.ie. Met Eireann has over 2000 datasets across hundreds of synoptic stations all around the country. Many of these weather stations opened and closed at varying dates over the last century or two.
There are hourly, daily and monthly weather, climate and agmet datasets in various formats such as CSV, JSON, json-stat etc.
Elements measured include precipation, air temperature, grass temperature, wind speed, sunshine, cloud amount, visibility and more.
I previously retrieved the hourly and monthly observations csv datasets, did some data munging and merged the monthly datasets together. There is another dataset that provides location data such as latitude and longitude. This datasets included stations that have since closed and has the open and close years of each station. I merged the station details dataset with the monthly observations dataset. This resulted in quite a large file.
All the datasets were retrieved from within a Jupyter notebook using the CKAN APIs, first using the package_list API to get the names of the packages or the package_search or resource_search APIs to search for datasets matching a query. The package_show API can then be used to get a JSON representation of the dataset which includes the URLs to the actual datasets. I wrote a Python class that incorporate several of the CKAN API’s and also
I then retrieved the datasets using the opendata class I wrote that incorporates the above mentioned CKAN APIs and retrieves the datasets. It includes some methods for retrieving the lists of packages/datasets, tags and organisations, search for datasets matching a query and then retrieves the datasets from the URL.
Monthly weather datasets available through the CSO’s PXStat API.
I have since come across some more datasets which are much easier to work with. These are new datasets on https://data.gov.ie since July 2021 and were not on the list of packages / datasets I downloaded using the CKAN package_list API earlier in the year.
MTM01 Rainfall
MTM02 Temperature
MTM03 Sunshine
MTM04 Wind, Maximum Gale Gust
These datasets are available in both CSV and JSON-STAT format from the Central Statistics Office’s (CSO) new PxStat database.
(The PxStat database replaced the CSO’s StatBank database during this year also.)
There are some missing values in the datasets which are more than likely for the dates when individual weather stations were not actually in operation.
Instead of analysing the missing values in a notebook I will do so in the Dash app.
Climate Average datasets
There are also now some new climate average datsets containing monthly elements averaged over a 30-year period for some of Met Eireann’s synoptic stations from 1961 to 1990, 1971 to 2000 and 1981 to 2010.
Values for each month include: temperature variables, relative humidity at 09:00 UTC and 15:00 UTC, sunshine in hours, rainfall variables, wind variables and the mean number of days with different weather phenomena.
These Climate average datasets seem to have been listed on https://data.gov.ie in June 2021 and are likely to be easier to work with that all the separate monthly datasets.
I have looked at the new datasets mentioned above (MTM101 to MTM04) which include measurements on temperature, sunshine, rainfall and wind for 15 meterological weather stations through Ireland.
The app consists of a Python script that uses several Dash libraries and datasets from https://data.gov.ie. It uses the Dash Bootstrap Components library for styling. Dash Bootstrap Components is a third party app that basically allows you to use Bootstrap classes to style your app.
The app reads in several datasets that have been downloaded to the app’s project repo. The script could also read in these datasets from source and do whatever cleaning is required.
It uses dropdowns, sliders, tabs, markdown and graph components.
Working with the graph components is just like using Plotly itself.
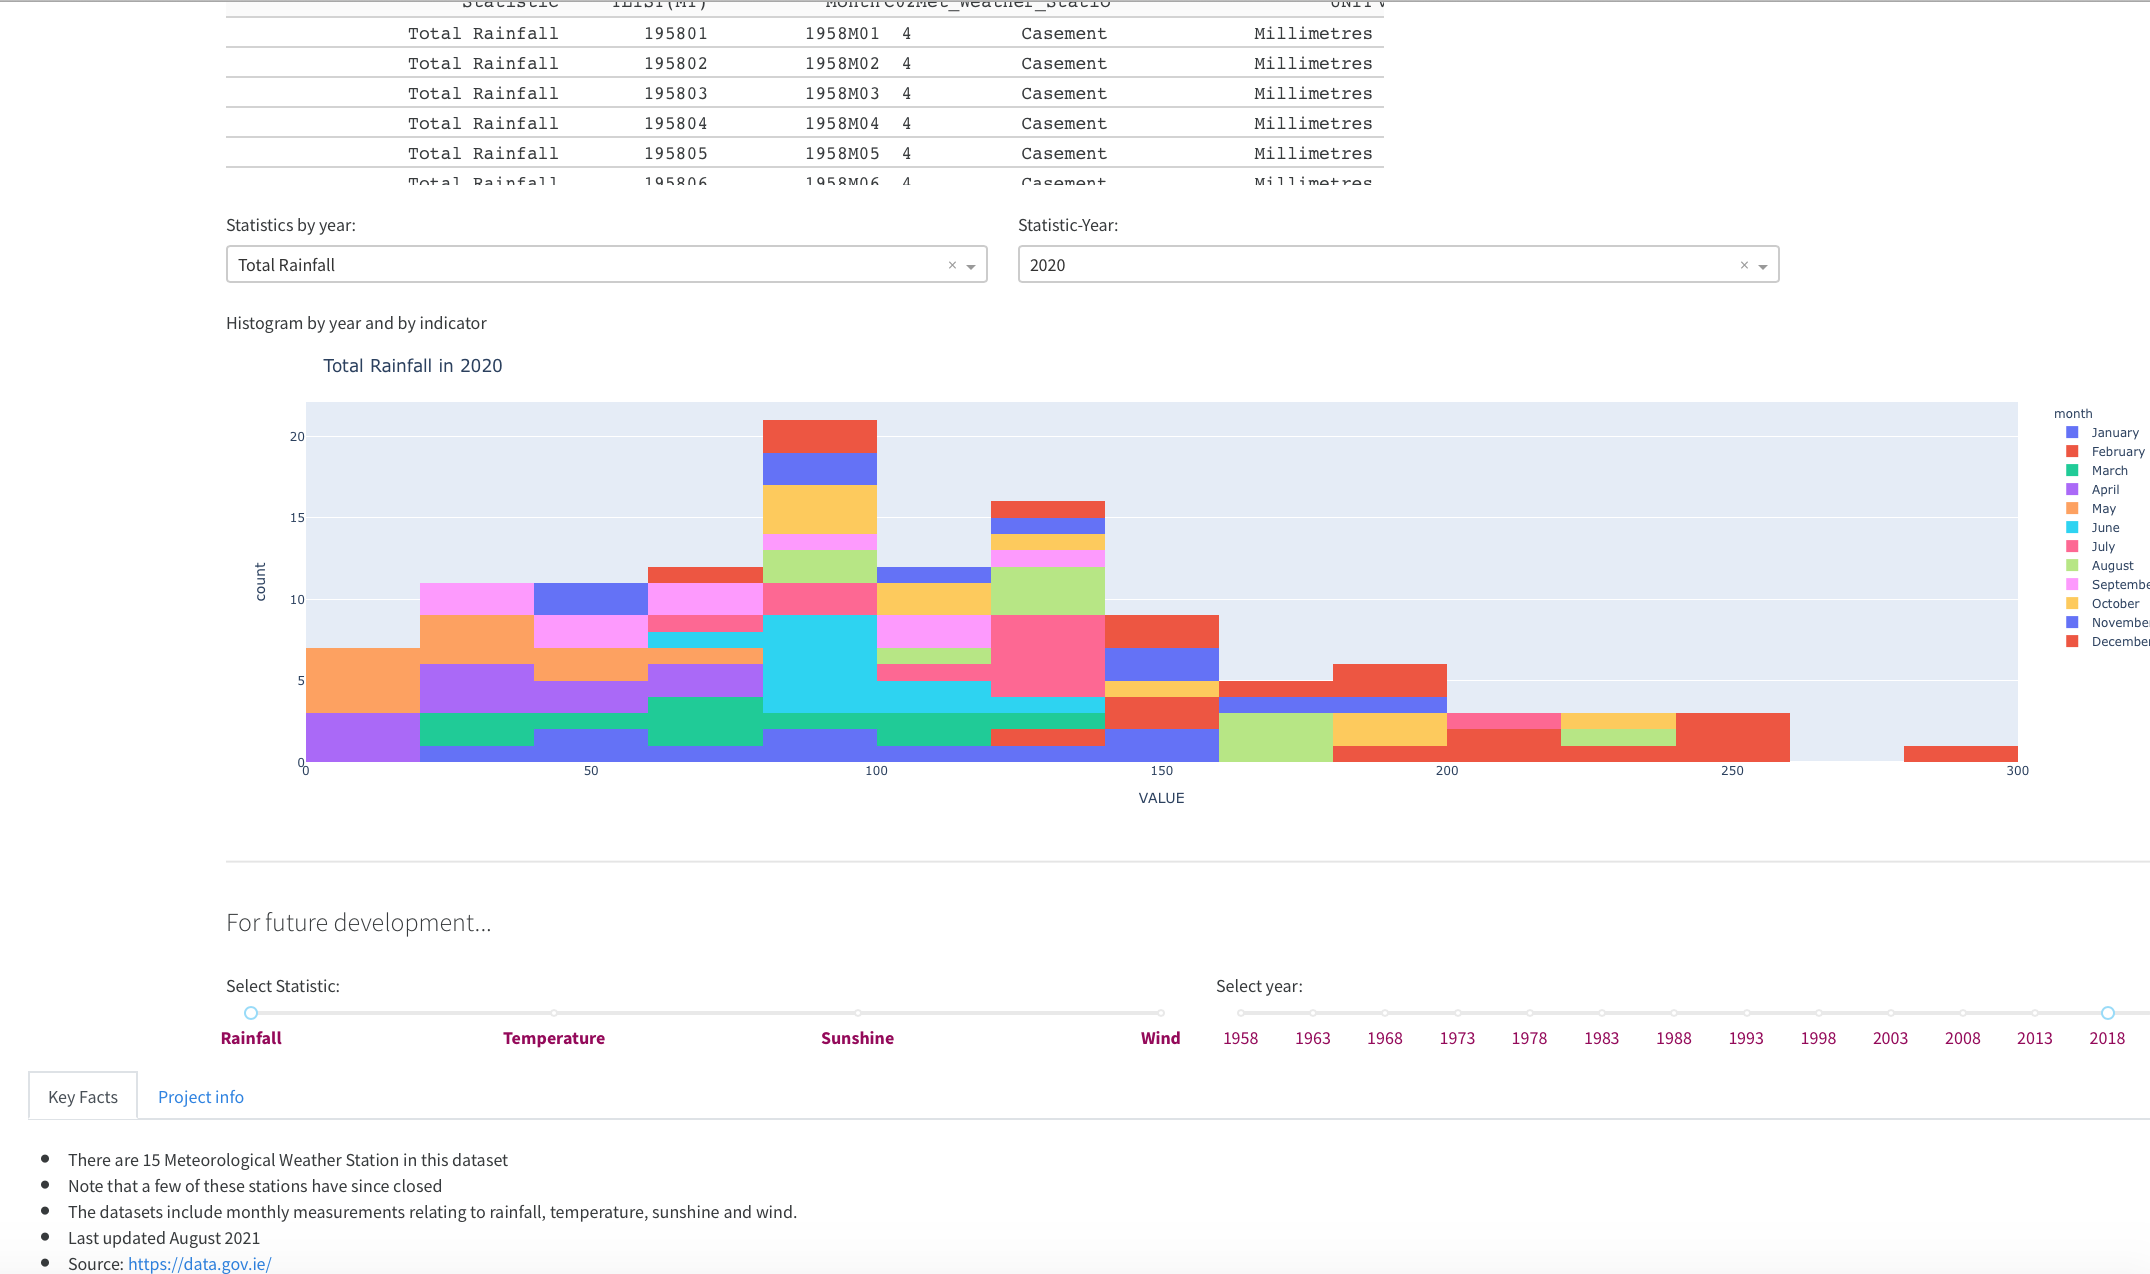
Callback functions are used to link the user’s options (selecting from dropdowns or sliders) with the plots. For example you can select a year, a weather measurement type (rainfall, sunshine, wind etc) and weather stations from the options. This will change the graph that is produced.
The app is very basic for now. However perfection is the enemy of getting things done so I will chip away at it and make it better!
I have deployed the app to Heroku:
angela1-weather-app.
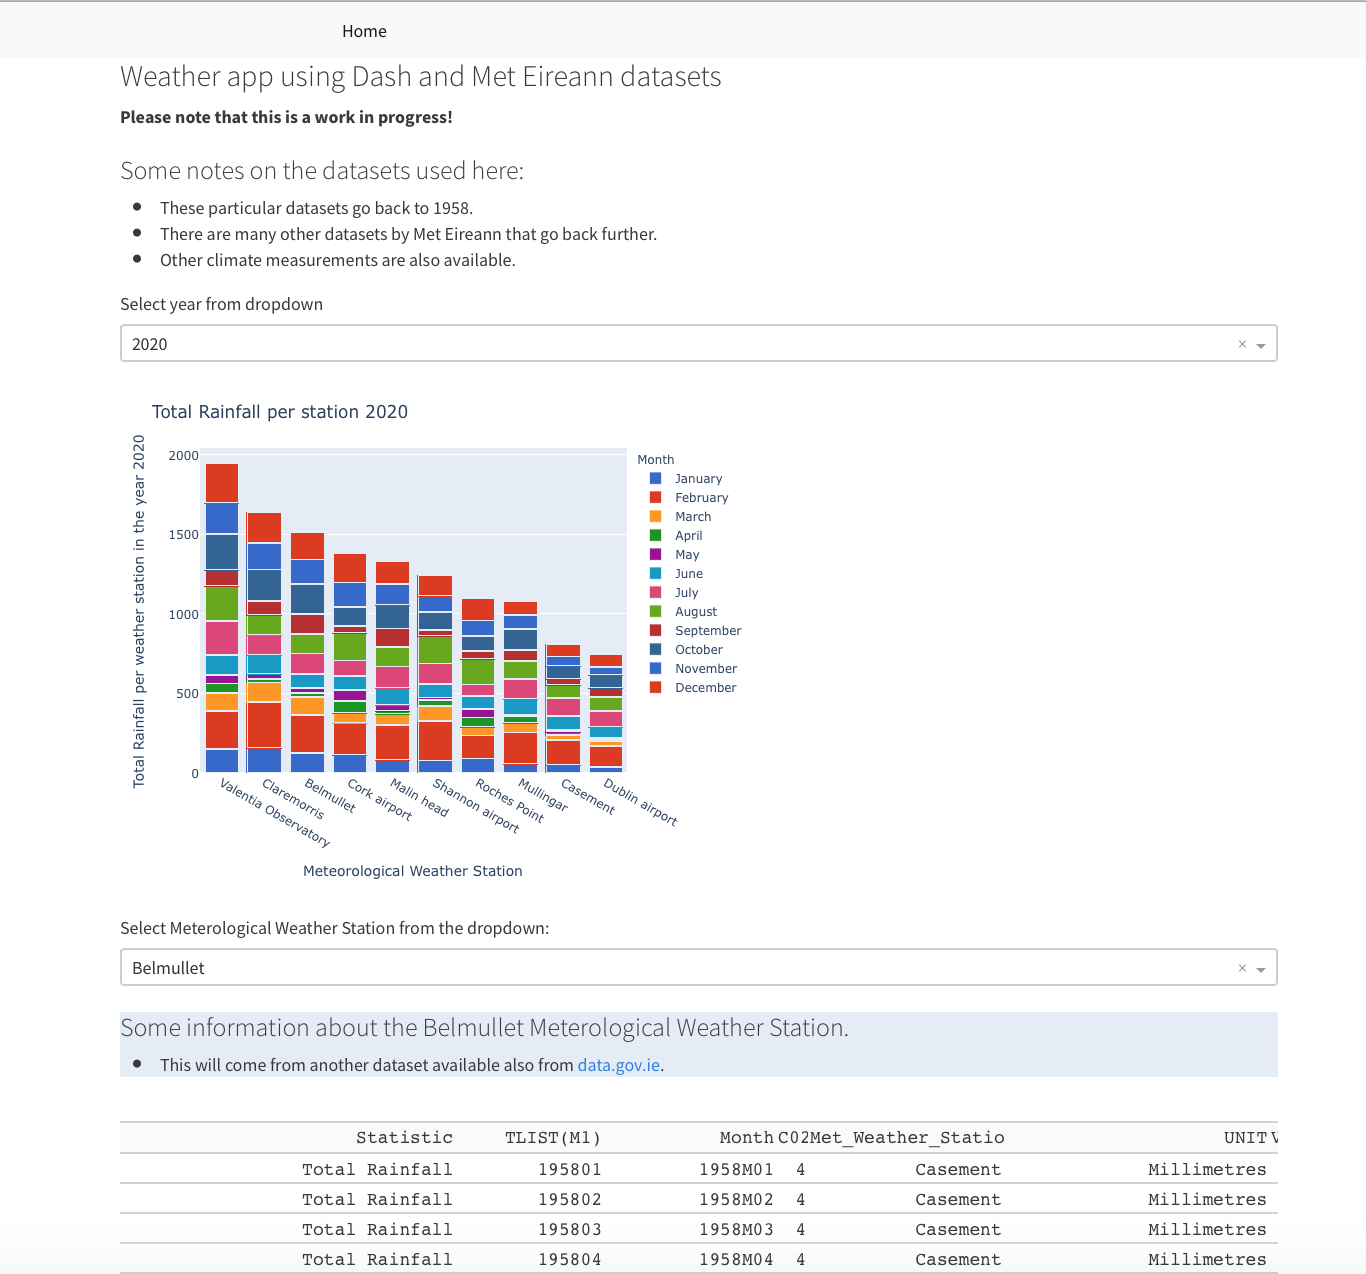
Here are some screen prints of the app as it is at the moment.
A Navbar
Some Markdown
A dropdown to select a year
A barchart that shows the total rainfall for the selected year